27 May 2021
This briefing provides an update on previous briefings up to 22 May 202
Summary
There are 5 variants of concern and 9 variants under investigation (Table 1). This report has been published to continue to share detailed surveillance of VOC-21APR02 (B.1.617.2) and information on a new variant under investigation VUI-21MAY-02 (C.36.3). A separate report is published covering our routine data on all other VOCs and VUIs. These additional specialist technical briefings represent early data and analysis on an emerging variant and findings have a high level of uncertainty.
Whilst case numbers remain very low, the proportion of cases which are VOC-21APR-02 (B.1.617.2) has continued to increase, as monitored through both genomic and S gene target data. VOC-21APR-02 is likely to be the predominant variant in England although there is regional heterogeneity.
Iterated vaccine effectiveness analysis combined with additional neutralisation data from multiple samples tested at multiple laboratories continues to support the assessment of reduced vaccine effectiveness after the first dose. The median time to onset of symptoms in household contacts, where the index case is B.1.617.2, is 4 days, which is the same as for B.1.1.7 (using routine contact tracing data). Longitudinal sampling studies have commenced.
Data on hospital admissions with vaccination status is now included and will form part of ongoing surveillance and vaccine effectiveness monitoring.
K417N, a receptor binding domain mutation associated with antigenic change and present in B.1.351 (VOC-20DEC-02), has been noted in a small number of cases of B.1.617.2, in addition to the standard mutations for this lineage.
The risk assessment for VOC-21APR-02 (B.1.617.2) is published separately.
Published information on variants
The collection page gives content on variants, including prior technical briefings. Definitions for variants of concern, variants under investigation and signals in monitoring are detailed in technical briefing 8. Data on variants not detailed here is published in the variant data update. Variant risk assessments are available in prior technical briefings. A repository containing the up-to-date genomic definitions for all variants of concern (VOC) and variants under investigation (VUI) as curated by Public Health England was created on 5 March 2021. The repository can be accessed on GitHub.
Part 1: Surveillance overview
Variants under surveillance
Table 1 shows the current variants of concern (VOC) and variants under investigation (VUI). Figure 1 shows the proportion of cases sequenced over time. Summary epidemiology on each variant is shown in Table 2, case numbers are also updated online. Tables 3a and 3b show hospitalisation and death data. Figure 2 shows cumulative cases of variants over time, indexed by the day of the fifth case.
Table 1. Variant lineage and designation as of 25 May 2021 (provisionally extinct variants removed)
| Lineage |
Designation |
First detected in sequence from |
Status |
| B.1.1.7 |
VOC-20DEC01 |
UK |
VOC |
| B.1.351 |
VOC-20DEC02 |
South Africa |
VOC |
| P1 |
VOC-21JAN-02 |
Japan ex Brazil |
VOC |
| B1.1.7 with E484K |
VOC-21FEB02 |
UK |
VOC |
| B.1.617.2 |
VOC-21APR-02 |
India |
VOC |
| P2 |
VUI-21JAN-01 |
Brazil |
VUI |
| A.23.1 with E484K |
VUI-21FEB-01 |
UK |
VUI |
| B.1.525 |
VUI-21FEB-03 |
UK |
VUI |
| B.1.1.318 |
VUI-21FEB-04 |
UK England |
VUI |
| P3 |
VUI-21MAR-02 |
Philippines |
VUI |
| B.1.617.1 with E484Q |
VUI-21APR-01 |
India |
VUI |
| B.1.617.3 |
VUI-21APR-03 |
India |
VUI |
| AV.1 |
VUI-21MAY-01 |
UK |
VUI |
| C.36.3 |
VUI-21MAY-02 |
Thailand ex Egypt |
VUI |
| B.1.429 |
|
|
Monitoring |
| B.1.1.7 with S494P |
|
|
Monitoring |
| A.27 |
|
|
Monitoring |
| B.1.526 |
|
|
Monitoring |
| B.1.1.7 with Q677H |
|
|
Monitoring |
| B.1.620 |
|
|
Monitoring |
| B1.214.2 |
|
|
Monitoring |
| B.1.1.1 with L452Q and F490S |
|
|
Monitoring |
| R.1 |
|
|
Monitoring |
| B.1.1.28 with N501T and E484Q |
|
|
Monitoring |
| B.1.621 |
|
|
Monitoring |
| B.1 with 214insQAS |
|
|
Monitoring |
| AT.1 |
|
|
Monitoring |
Sequencing coverage
Figure 1 shows the proportion of cases which are sequenced in England.
Figure 1. Coverage of sequencing: percentage of SARS-CoV-2 cases sequenced over time as of 24 May 2021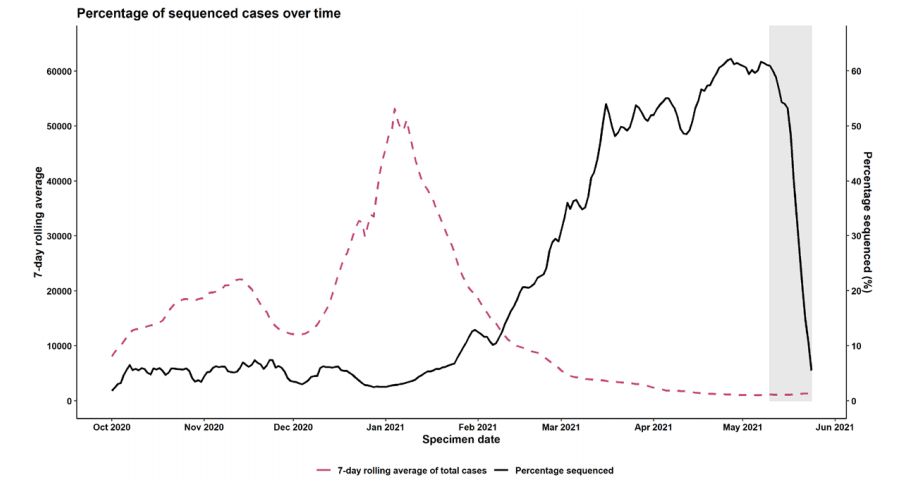
VOC and VUI case numbers, proportion, deaths and case fatality rate
Table 2 shows the number of cases and deaths associated with each variant of concern and variant under investigation, and the proportion of total sequenced cases accounted for by each variant. Table 3 shows the number of cases known to be infected with VOC/VUIs who visited an NHS Emergency Department, the number who were admitted, and the number who died in any setting (note data is shown from 1 February 2021 onwards to enable comparison). Figure 2 shows the cumulative number of cases per variant indexed by days since first report.
Table 2. Case number, proportion, death and case fatality rate of variants of concern and variant under investigation from 1 October 2020 to 25 May 2021
| Variant |
Case Number |
Case Proportion |
Deaths |
Case Fatality |
| VOC-20DEC-01 |
210,662 |
96.374% |
4,152 |
2.0%(1.9 to 2.0%) |
| VOC-20DEC-02 |
831 |
0.38% |
13 |
1.6%(0.8 to 2.7%) |
| VOC-21APR-02* |
5,599 |
2.561% |
12 |
0.2%(0.1 to 0.4%) |
| VOC-21FEB-02 |
43 |
0.02% |
1 |
2.3%(0.1 to 12.3%) |
| VOC-21JAN-02 |
145 |
0.066% |
0 |
0.0%(0.0 to 2.5%) |
| VUI-21APR-01 |
406 |
0.186% |
0 |
0.0%(0.0 to 0.9%) |
| VUI-21APR-03 |
14 |
0.006% |
0 |
0.0%(0.0 to 23.2%) |
| VUI-21FEB-01 |
79 |
0.036% |
2 |
2.5%(0.3 to 8.8%) |
| VUI-21FEB-03 |
430 |
0.197% |
12 |
2.8%(1.5 to 4.8%) |
| VUI-21FEB-04 |
228 |
0.104% |
1 |
0.4%(0.0 to 2.4%) |
| VUI-21JAN-01 |
54 |
0.025% |
1 |
1.9%(0.0 to 9.9%) |
| VUI-21MAR-01 |
2 |
0.001% |
0 |
0.0%(0.0 to 84.2%) |
| VUI-21MAR-02 |
6 |
0.003% |
0 |
0.0%(0.0 to 45.9%) |
| VUI-21MAY-01 |
90 |
0.041% |
0 |
0.0%(0.0 to 4.0%) |
Excludes variant cases not linked to a known COVID-19 case or with provisional sequencing/genotyping results.
aCase number England genomic cases 25 May 2021.
bDeaths As of 25 May 2021 (within 28 days) with confirmed or probable VOC or total cases.
c95% Confidence Intervals calculated with Clopper–Pearson exact method, using R package PropCIs.
* VOC-21APR-02 includes a high proportion of recent cases who have not completed 28 days of follow up
Table 3a. Attendance to emergency care and deaths among all COVID-19 sequenced cases in England, 1 February 2021 to 25 May 2021
| Variant |
Cases since 01 Feb 2021¥ |
Cases still under follow-up* |
Cases with an A&E visit§ |
Cases where presentation to A&E resulted in overnight inpatient admission§ |
Deaths^ |
|
|
Number |
% |
Number |
% |
Number |
% |
Number |
% |
| VOC-20DEC-01 |
136,048 |
9,554 |
7.0 |
5,391 |
4.0 |
2,079 |
1.5 |
1,703 |
1.3 |
| VOC-20DEC-02 |
628 |
74 |
11.8 |
26 |
4.1 |
9 |
1. |
8 |
1.3 |
| VOC-21JAN-02 |
145 |
36 |
24.8 |
7 |
4.8 |
1 |
0.7 |
0 |
NA |
| VOC-21FEB-02 |
17 |
0 |
NA |
0 |
NA |
0 |
NA |
1 |
5.9 |
| VOC-21APR-02 |
5,599 |
4,665 |
83.3 |
201 |
3.6 |
43 |
0.8 |
12 |
0.2 |
| VUI-21JAN-01 |
24 |
0 |
NA |
1 |
4.2 |
1 |
1.2 |
0 |
NA |
| VUI-21FEB-01 |
8 |
0 |
NA |
0 |
NA |
0 |
NA |
0 |
NA |
| VUI-21FEB-03 |
376 |
39 |
10.4 |
10 |
2.7 |
3 |
0.8 |
7 |
1.9 |
| VUI-21FEB-04 |
221 |
43 |
19.5 |
3 |
1.4 |
0 |
NA |
1 |
0.5 |
| VUI-21MAR-02 |
6 |
0 |
NA |
0 |
NA |
0 |
NA |
0 |
NA |
| VUI-21APR-01 |
406 |
77 |
19.0 |
7 |
1.7 |
2 |
0.5 |
0 |
NA |
| VUI-21APR-03 |
14 |
2 |
14.3 |
0 |
NA |
0 |
NA |
0 |
NA |
| VUI-21MAY-01 |
90 |
76 |
84.4 |
0 |
NA |
0 |
NA |
0 |
NA |
Table 3b. Attendance to emergency care and deaths by vaccination status among VOC-21APR-02 confirmed cases in England, 1 February 2021 to 25 May 2021
|
Total |
Cases with specimen date in past 28 days |
Unlinked |
Unvaccinated |
< 21 days post dose 1 |
≥21 days post dose 1 |
Received 2 doses |
| VOC-21APR-02 cases since 01 Feb 2021¥ |
5,599 |
4,665 |
962 |
3,367 |
157 |
936 |
177 |
| Cases with an A&E visit§ |
201 |
NA |
6 |
138 |
7 |
45 |
5 |
| Cases where presentation to A&E resulted in overnight inpatient admission§ |
43 |
NA |
2 |
29 |
1 |
10 |
1 |
| Deaths^ |
12 |
NA |
0 |
8 |
0 |
2 |
2 |
Data sources: A&E attendance and admissions from Emergency Care Dataset (ECDS), deaths from PHE daily death data series (deaths within 28 days)
¥ Excludes unlinked sequences (sequenced samples that could not be matched to individuals) and cases without specimen dates.
* This includes cases within 28 days of their specimen date. Cases are assessed for A&E attendance and hospitalisation within 28 days of their positive specimen date. Cases still within this 28 day period may have a hospital attendance reported at a later date.
§ At least one attendance within 28 days of positive specimen date; cases where specimen date is the same as or after the date of A&E visit are excluded to remove cases picked up via testing for the purpose of healthcare attendances. A&E visit and hospital attendance data are subject to reporting delay and therefore these data may be revised upwards.
^ Total deaths in any setting (regardless of hospitalisation status) within 28 days of positive specimen date.
Figure 2. Cumulative cases in England of variants indexed by days since the fifth reported, data as of 25 May 2021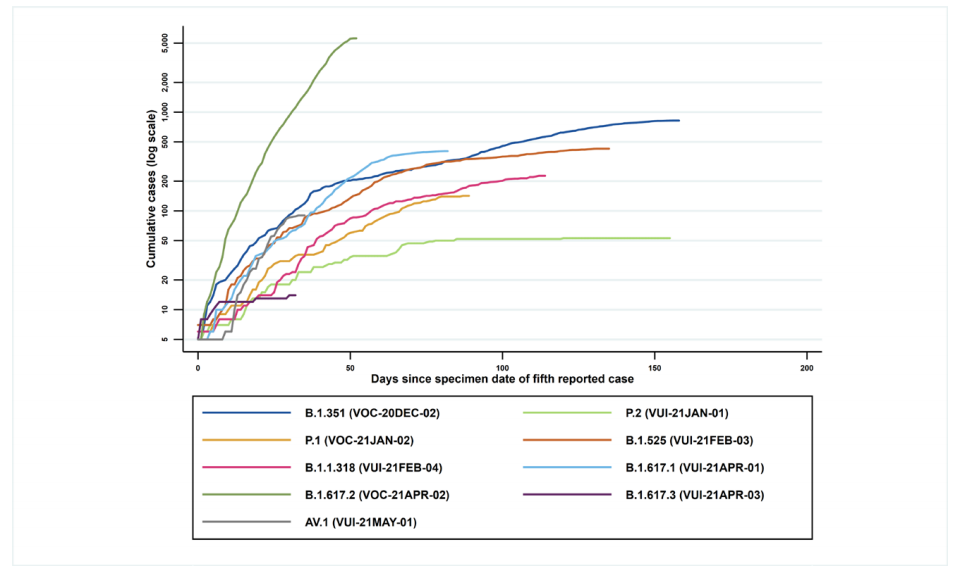
(Find accessible data used in this graph in underlying data). Figure 2 demonstrates the rapid identification of VOC-21APR-02 (B.1.617.2) cases over a short period of time
Variant prevalence
The prevalence of different variants amongst all sequenced cases is presented in Figure 3, split by region in Figure 4 and by travel status in Figure 5. The ‘Other’ category in Figure 3 and Figure 4 includes genomes where the quality is insufficient to determine variant status and genomes that do not meet the current definition for any designated variant under investigation or variant of concern. The total genomic dataset used for this assessment includes enhanced testing and sequencing from individuals who have travelled, and surge testing and sequencing in outbreak areas. Sequencing numbers and coverage fall in the last week shown due partly to sequencing lag time, and new sequences are still being produced relating to sample dates in that week. Rapid genotyping assay results that have not been confirmed by sequencing have been removed from this dataset. The supplementary data for figures are available.
Figure 3. Variant prevalence for all England available case data from 1 February 2021 as of 25 May 2021 (excluding cases where the specimen date was unknown)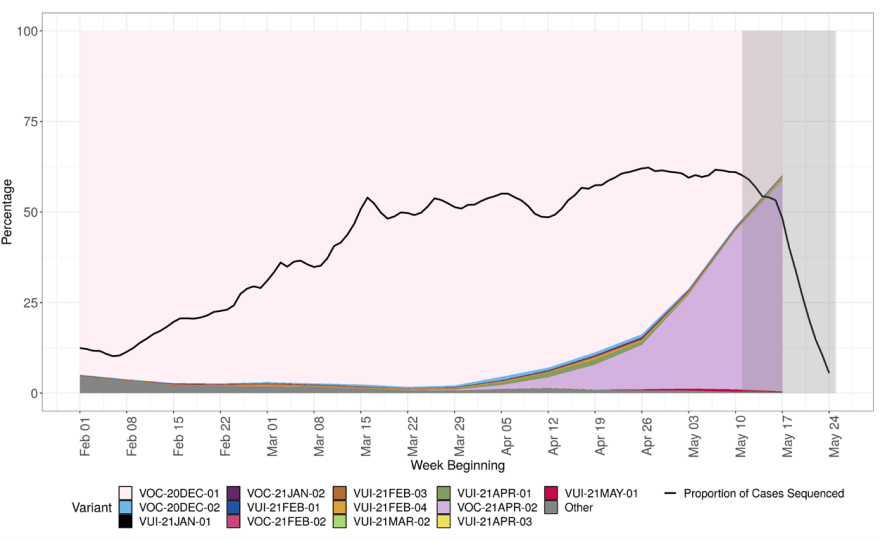
The most recent data shows 58% of sequenced cases are VOC-21APR-02. At the latest data point where there is complete data (outside the grey region), 43% of sequenced cases are VOC-21APR-02. The black line indicates proportion of cases sequenced in a 7-day rolling window. The area in grey shows weeks where the sequence data is still accumulating, therefore the proportions are less likely to accurately reflect prevalence. Rapid genotyping assay results that have not been confirmed by sequencing have been removed from this dataset. (Find accessible data used in this graph in
Figure 4. Variant prevalence for all England available case data from 1 February 2021 as of 25 May 2021 by region (excluding cases where the region or specimen date were unknown)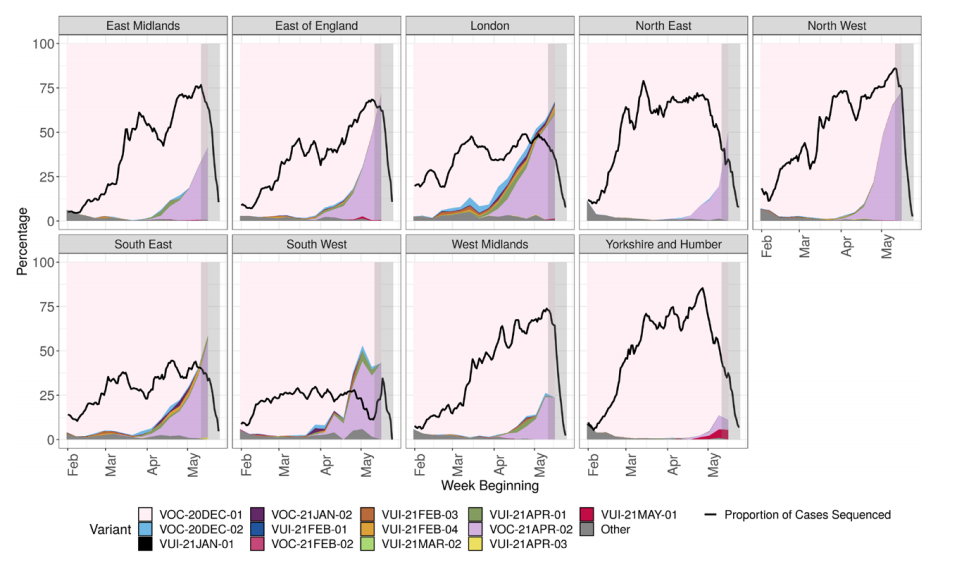
In figure 4, the black line indicates proportion of cases sequenced in a 7-day sliding window. The area in grey shows weeks where the sequence data is still accumulating, therefore the proportions are less likely to accurately reflect prevalence. Rapid genotyping assay results that have not been confirmed by sequencing have been removed from this dataset. Data for most recent 2 weeks is incomplete. (Find accessible data used in this graph in
Figure 5. Prevalence of variants over time: all sequenced cases in England, split by travel status as of 25 May 2021 (excluding cases where the specimen date is unknown)
Travel status is assigned based an interval of <= 14 days between arrival date and positive specimen date. It is derived through matching to Passenger Locator Forms, contact-tracing, international arrivals and local HPT survey data. The area in grey shows weeks where the sequence data is still accumulating, therefore the proportions are less likely to accurately reflect prevalence. Rapid genotyping assay results that have not been confirmed by sequencing have been removed from this dataset. The total number of sequenced cases in each week is shown in the bars below, split by travel status. (Find accessible data used in this graph in
Variant Growth rates
Logistic growth rates (1/week from 1 January 2021 as of 25 May 2021) relative to VOC20DEC-01 (B.1.1.7) are calculated for each VUI or VOC with more than 20 samples and shown in Table 4. Sample inclusion criteria are: 1) A non-traveller as determined by matching each case against passenger locator forms and managed quarantine service test codes 2) Collected from Pillar 2 testing. 3) If multiple sequences are collected from the same patient which show the same variant, the first sample is retained. Additionally, samples with missing or unknown date of sample collection or upper tier local authority (UTLA) of residence are excluded.
A sample of VOC-20DEC-01 (B.1.1.7) is collected for measuring relative growth rates by weighting each VOC-20DEC-01 (B.1.1.7) sample by the proportion of the VUI or VOC which are sampled in each UTLA. Any VOC-20DEC-01 (B.1.1.7) samples collected outside the period of time that the VUI or VOC are observed are excluded as are VOC20DEC-01 (B.1.1.7) samples collected in UTLAs where the VUI or VOC have not yet been detected. The growth rate is estimated by logistic regression of the variant on time of sample collection. A growth rate of 0 would indicate parity with VOC-20DEC-01 (B.1.1.7). Growth rate is context dependent and cannot be interpreted as a change in biological transmissibility.
Compared to VOC-20DEC-01 (B.1.1.7), VOC-21APR-02 (B.1.617.2) displays an increased logistic growth rate indicating that the proportion of samples that are VOC21APR-02 is increasing.
Table 4. Growth rate of variants of concern and variants under investigation 1 January 2021 as of 25 May 2021
| Variant |
Growth rate (1/week) |
| VOC-20DEC-02 |
0.16 (p=9.366e-36, n=337) |
| VOC-21JAN-02 |
-0.098 (p=0.15, n=21) |
| VUI-21JAN-01 |
0.32 (p=1.191e-15, n=74) |
| VUI-21FEB-03 |
-0.31 (p=0.0004, n=55) |
| VUI-21FEB-01 |
0.11 (p=2.54e-11, n=192) |
| VUI-21FEB-04 |
0.19 (p=1.682e-15, n=126) |
| VOC-21APR-01 |
0.32 (p=4.27e-18, n=149) |
| VUI-21APR-02 |
0.94 (p=0, n=4,699) |
| VUI-21APR-03 |
0.98 (p=0.12, n=5) |
Sample sizes (n) correspond to the number of VUI or VOC used in the analysis. P values correspond to the null hypothesis that there is no difference in VUI/VOC growth rates and VOC-20DEC-01 (B.1.1.7) growth rates
Use of rapid genotyping assays
Rapid genotyping assays are being rolled out across the testing laboratory network and have been amended to incorporate VOC-21APR-02 detection. At present the genotyping assay detects P681R, N501Y, K417N, K471T and deletion 69-70 (‘S gene target failure’). Genotyping results are confirmed by sequencing. Data presented in the technical briefing currently uses either genomic or S gene target data. Genotyping assay results will be incorporated in the coming weeks.
Secondary attack rates
This section includes secondary attack rates for traveller and non-traveller cases, and separate household contact rates. It also includes a new analysis of time to onset of symptoms in household contacts.
Secondary attack rates are based on positive tests amongst contacts named to NHS Test and Trace by an original case identified with a confirmed or probable variant of concern or variant under investigation.
Secondary attack rates are shown for cases with and without travel history. In non-travel settings, only close contacts (household members, face to face contact, people within 1 metre of the case for 1 minute or longer, or people within 2 metres for 15 minutes) named by the original case are included. In travel settings the contacts reported are not restricted to only close contacts named by the case (for example, they may include contacts on a plane linked by additional contact tracing efforts), leading to likely deflation of secondary attack rates amongst travellers compared to non-travellers. In addition, people recently returning from overseas are subject to stricter quarantine measures and may moderate their behaviour towards contacts. Travel history indicates, but does not confirm, where infection of the original case occurred.
Table 5 shows the secondary attack rates for VOC-21APR-02 (B.1.617.2) compared to the other B.1.617 variants and VOC-20DEC-01 (B.1.1.7). The time period of study for secondary attack rates has been restricted to the period 29 March 2021 to 4 May 2021, to capture recent social restrictions and vaccination levels. A reduction in secondary attack rate for non-travel cases with VOC-20DEC-01 is observed in this shorter period when compared to Table 6 covering 05 January 2021 to 4 May 2021.
Secondary attack rates for contacts of cases with VOC-21APR-02 (B.1.617.2) and no travel history are higher than those for contacts of non-travel cases with VOC-20DEC-01 (B.1.1.7): 13.5% compared to 8.1%. Estimates of secondary attack rates for contacts of those that have travelled with variants of concern or variants under investigation were all considerably lower than those that have not travelled, due to the difference in contact
definition. Secondary attack rates for contacts of travel cases with VOC-21APR-02 (B.1.617.2) were higher than those for travel cases with VOC-20DEC-01 (B.1.1.7).
Table 6 shows the secondary attack rates for variants (excluding B.1.617 variants) for the period 5 January 2021 to 4 May 2021. Secondary attack rates for contacts of non-travel cases with VOC-21FEB-02 and VUI-21MAY-01 were lower than for contacts of non-travel cases with VOC-20DEC-01 over this time. All other secondary attack rates for contacts of non-travel cases with the remaining variants of concern or under investigation are not significantly different from VOC-20DEC-01. Estimates of secondary attack rates for contacts of those that have travelled with variants of concern or variants under investigation were all considerably lower than those that have not travelled, due to the difference in contact definition.
Table 7 shows the secondary attack rates amongst household and non-household contacts of non-travel cases with VOC-21APR-02 (B.1.617.2) and VOC-20DEC-01 (B.1.1.7). The time period of study for secondary attack rates has been restricted to the period 29 March 2021 to 4 May 2021 as in Table 5. Secondary attack rates are higher amongst household contacts than non-household contacts of non-travel cases with both variants and higher for contacts of non-travel cases with VOC-21APR-02 (B.1.617.2) than VOC-20DEC-01 (B.1.1.7); this is consistent with Table 5.
Fig 6 (and Table 8) shows the time interval between index and secondary case onset for household contacts, and between exposure date and secondary case onset for nonhousehold contacts. The median interval for household exposures is 4 days for both VOC20DEC-01 and VOC-21APR-02. For non-household exposures, the median interval from exposure date to secondary case onset is also 4 days for VOC-20DEC-01, but 5 days for VOC-21APR-02.
Table 5. Secondary attack rates for VUI-21APR-01 (B.1.617.1), VOC-21APR-02 (B.1.617.2) and VUI-21APR-03 (B.1.617.3), presented with VOC-20DEC-01 (B.1.1.7), time restricted for comparison (29 March 2021 to 4 May 2021, variant data as at 18 May 2021, contact tracing data as at 25 May 2021)
| Variant |
Cases in those that have travelled (% with contacts) |
Cases in those that have not travelled or unknown (% with contacts) |
Case prop ortion that have trav elled |
Secondary Attack Rate among contacts of those that have travelled (95% CI) [secondary cases/conta cts] |
Secondary Attack Rate among contacts of cases that have not travelled or unknown (95% CI) [secondary cases/contacts] |
| VOC-20DEC-01 |
1,738 (71.2% with contacts) |
26,437 (81.8% with contacts) |
6.2% |
1.7% (1.5% to 1.8%) [452/26,934] |
8.1% (7.9% to 8.3%) [5,587/68,713] |
| VUI-21APR-01 |
158 (78.5% with contacts) |
119 (79.0% with contacts) |
57.0% |
2.2% (1.7% to 2.9%) [56/2,509] |
11.0% (7.9% to 15.0%) [33/301] |
| VOC-21APR-02 |
404 (70.8% with contacts) |
1,446 (83.4% with contacts) |
21.8% |
2.9% (2.5% to 3.4%) [174/5,908] |
13.5% (12.5% to 14.6%) [537/3,977] |
| VUI-21APR-03 |
4 (25.0% with contacts) |
5 (100.0% with contacts) |
44.4% |
Unavailable [1/3] |
Unavailable [1/12] |
Secondary attack rates are marked as ‘Unavailable’ when count of contacts is less than 50 or count of exposing cases is less than 20. Travel-linked cases for secondary attack rates are identified positively in NHS Test and Trace data using multiple PHE sources. A case is considered as being travel-linked if EpiCell or Health Protection Teams have found evidence of international travel, their NHS Test and Trace record mentions an event associated with international travel, their NHS Test and Trace record was created after notification via IHR NFP, their contacts were traced by the international contact tracing team or they have been marked for priority contact tracing in NHS Test and Trace for reasons of travel. Some travel-linked cases may be missed by these methods and would be marked as non-travel-linked or unknown.
Secondary attack rates from NHS Test and Trace should generally be considered lower bounds due to the nature of contact tracing and testing. Data provided is for period 29 March 2021 to 4 May 2021 in order to allow time for contacts to become cases, hence case counts are lower than other sources. Provisional results are excluded.
Table 6. Secondary attack rates for all variants (excluding B.1.617 variants) (5 January 2021 to 4 May 2021, variant data as at 18 May 2021, contact tracing data as at 25 May 2021)
| Variant |
Cases in those that have travelled (% with contacts) |
Cases in those that have not travelled or unknown (% with contacts) |
Case prop ortion that have trav elled |
Secondary Attack Rate among contacts of those that have travelled (95% CI) [secondary cases/conta cts] |
Secondary Attack Rate among contacts of cases that have not travelled or unknown (95% CI) [secondary cases/contacts] |
| VOC-20DEC-01 |
3,906(77.8% with contacts) |
165,560(74.4% with contacts) |
2.3% |
1.7%(1.6% to 1.8%)[1,170/69,210] |
9.9%(9.8% to 10.0%)[34,166/344,947] |
| VOC-20DEC-02 |
291(72.9% with contacts) |
334(66.5% with contacts) |
46.6% |
2.5%(2.1% to 3.1%)[106/4,162] |
9.0%(7.1% to 11.4%)[63/698] |
| VUI-21JAN-01 |
3(66.7% with contacts) |
32(75.0% with contacts) |
8.6% |
UnaVailable[0/137] |
8.1%(3.5% to 17.5%)[5/62] |
| VOC-21JAN-02 |
55(60.0% with contacts) |
60(66.7% with contacts) |
47.8% |
0.9%(0.4% to 2.2%)[5/536] |
11.0%(6.9% to 17.1%)[16/146] |
| VUI-21FEB-01 |
0(0 with contacts) |
63(60.3% with contacts) |
0.0% |
UnaVailable[0/0] |
8.6%(4.4% to 16.1%)[8/93] |
| VOC-21FEB-02 |
1(100.0% with contacts) |
33(81.8% with contacts) |
2.9% |
UnaVailable[0/96] |
0.0%(0.0% to 3.3%)[0/111] |
| VUI-21FEB-03 |
190(71.1% with contacts) |
177(73.4% with contacts) |
51.8% |
1.3%(1.0% to 1.7%)[55/4,184] |
9.0%(6.3% to 12.5%)[30/335] |
| VUI-21FEB-04 |
79(68.4% with contacts) |
114(75.4% with contacts) |
40.9% |
0.6%(0.3%-1.0%)[13/2,193] |
9.4% (6.3% – 13.8%) [22/235] |
| VUI-21MAR-01 |
1(100.0% with contacts) |
0(0 with contacts) |
100.0% |
UnaVailable[0/7] |
UnaVailable[0/0] |
| VUI-21MAR-02 |
4(25.0% with contacts) |
1(100.0% with contacts) |
80.0% |
UnaVailable[0/4] |
UnaVailable[0/3] |
| VUI-21MAY-01 |
2(0.0% with contacts) |
26(84.6% with contacts) |
7.1% |
UnaVailable[0/0] |
3.3% (1.1% to 9.2%) [3/92] |
Secondary attack rates are marked as ‘Unavailable’ when count of contacts is less than 50 or count of exposing cases is less than 20. Travel-linked cases for secondary attack rates are identified positively in NHS Test and Trace data using multiple PHE sources. A case is considered as being travel-linked if EpiCell or Health Protection Teams have found evidence of international travel, their NHS Test and Trace record mentions an event associated with international travel, their NHS Test and Trace record was created after notification via IHR NFP, their contacts were traced by the international contact tracing team or they have been marked for priority contact tracing in NHS Test and Trace for reasons of travel. Some travel-linked cases may be missed by these methods and would be marked as non-travel-linked or unknown.
Secondary attack rates from NHS Test and Trace should generally be considered lower bounds due to the nature of contact tracing and testing. Data provided is for period 5 January 2021 to 4 May 2021 in order to allow time for contacts to become cases, hence case counts are lower than other sources. Provisional results are excluded.
Table 7. Secondary attack rates for household contacts of non-travel cases of VOC-20DEC-01 (B.1.1.7) and VOC-21APR-02 (B.1.617.2) (29 March 2021 to 4 May 2021, variant data as at 18 May 2021, contact tracing data as at 25 May 2021)
| Variant |
Cases in those that have not travelled or unknown (with household contacts, with nonhousehold contacts) |
Secondary Attack Rate among household contacts of cases that have not travelled or unknown (95% CI) [secondary cases/contacts] |
Secondary Attack Rate among nonhousehold contacts of cases that have not travelled or unknown (95% CI) [secondary cases/contacts] |
| VOC-20DEC-01 |
2,6437 (79.7% with household, 17.9% with non-household contacts) |
8.9% (8.7% to 9.1%) [5,019/56,374] |
4.6% (4.2% to 5.0%) [568/12,339] |
| VOC-21APR-02 |
1,446 (81.3% with household, 16.2% with non-household contacts) |
15.0% (13.8% to 16.2%) [490/3,274] |
6.7% (5.1% to 8.8%) [47/703] |
Secondary attack rates are marked as ‘Unavailable’ when count of contacts is less than 50 or count of exposing cases is less than 20. Travel-linked cases for secondary attack rates are identified positively in NHS Test and Trace data using multiple PHE sources. A case is considered as being travel-linked if EpiCell or Health Protection Teams have found evidence of international travel, their NHS Test and Trace record mentions an event associated with international travel, their NHS Test and Trace record was created after notification via IHR NFP, their contacts were traced by the international contact tracing team or they have been marked for priority contact tracing in NHS Test and Trace for reasons of travel. Some travel-linked cases may be missed by these methods and would be marked as non-travel-linked or unknown.
Secondary attack rates from NHS Test and Trace should generally be considered lower bounds due to the nature of contact tracing and testing. Data provided is for period 29 March 2021 to 4 May 2021 in order to allow time for contacts to become cases, hence case counts are lower than other sources. Provisional results are excluded.
Fig. 6 Time interval to onset of symptoms in secondary case, household and non-household contacts of cases of VOC-20DEC-01 (B.1.1.7) and VOC-21APR-02 (B.1.617.2) (29 March 2021 to 5 May 2021, variant data as at 25 May, contact tracing data as at 26 May)
NHS Test and Trace data. Distribution of time in days from contact exposure to secondary case onset of symptoms. Periods restricted to between 2 to 14 days. Household exposure dates are taken as date of onset or test in primary case. (Find accessible data used in this graph in underlying data).
Table 8. Time interval to onset in secondary case, household and non-household contacts of cases of VOC-20DEC-01 (B.1.1.7) and VOC-21APR-02 (B.1.617.2) (29 March 2021 to 5 May 2021, variant data as at 25 May, contact tracing data as at 26 May)
| Variant |
Exposure type |
Secondary cases |
Median interval (days) |
| VOC-20DEC-01 |
Household |
5,376 |
4 |
| VOC-21APR-02 |
Household |
618 |
4 |
| VOC-20DEC-01 |
Non-household |
888 |
4 |
| VOC-21APR-02 |
Non-household |
160 |
5 |
NHS Test and Trace data. Distribution of time in days from contact exposure to secondary case onset of symptoms. Periods restricted to between 2 to 14 days. Household exposure dates are taken as date of onset or test in primary case.
Surveillance of reinfections
Individuals who have 2 positive tests (PCR and/or LFD) at least 90 days apart are classed as possible reinfection cases. A small proportion of reinfections have been sequenced through standard national surveillance sequencing. Table 9 shows the total number of sequences available from second episodes of infection in possible reinfection cases, categorized by variant. Figure 7 shows the number of different variants identified through sequencing that are possible reinfection cases. In recent weeks there have been a number of reinfections with VOC-21APR-02 (B.1.617.2). This is expected with any prevalent variant; comparative analyses are underway. Sequencing numbers fall in the last 2 weeks shown due partly to sequencing lag time, and new sequences are still being produced relating to sample dates in those weeks.
Table 9. Number of sequenced reinfection cases and the variant assigned. (Data as of 25 May 2021).
| Variant |
Total |
| VOC-20DEC-01 |
540 |
| VOC-20DEC-02 |
1 |
| VUI-21JAN-01 |
0 |
| VOC-21FEB-02 |
1 |
| VUI-21FEB-03 |
2 |
| VUI-21FEB-04 |
2 |
| VUI-21APR-01 |
2 |
| VOC-21APR-02 |
54 |
| VUI-21APR-03 |
0 |
| VUI-21MAY-01 |
1 |
| Total sequenced |
812 |
Figure 7. The number of reinfections cases from all sample sources, with the total number of reinfections cases with sequences, and the number of variant sequences over time as of 25 May 2021
SARS-CoV-2 Immunity and Reinfection Evaluation (the SIREN study) cohort monitoring
The SIREN study is a cohort of National Health Service healthcare workers, including 135 sites and 44,549 participants across the UK, 35,720* in England, who are tested every 2 weeks for COVID-19 by PCR, and who have monthly serological testing. This cohort had a high seropositivity on recruitment (30% before the second wave) and is now vaccinated (95%). The incidence of new infections and potential reinfections in SIREN is monitored and would be expected to rise if a new variant became highly prevalent and was able to escape either natural or vaccine-derived immunity. During the period of time that VOC21APR-02 (B.1.617.2) became prevalent, there has been no increase in PCR-positive participants in the SIREN cohort overall (Figure 8) and reinfections remain at very low numbers in individuals previously either PCR positive or seropositive (Figure 9).
Figure 8. PCR positivity within the SIREN study for all regions, England (fortnightly testing interval). Data up to 23 May 2021
Contains only participants with at least one PCR test within given period; participants are counted as positive if at least one PCR test within given period is positive; only samples collected during the SIREN study (that is baseline and follow-up); figures have not been restricted by antibody status nor vaccination status, therefore will include participants presumed no longer susceptible to a new infection; includes only participants from England trusts.
* This is the number who enrolled and have not subsequently withdrawn and requested their data to be deleted (Find accessible data used in this graph in underlying data).
Figure 9. Monthly frequency of potential reinfections within SIREN. Data up to 25 May 2021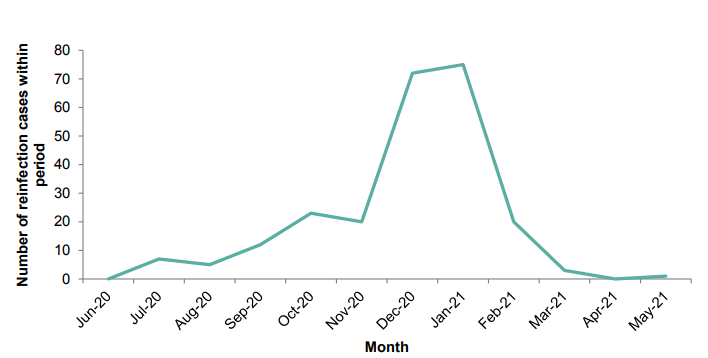
.
Part 2: VOC-21APR-02 (B.1.617.2)
surveillance
VUI-21APR-02 (B.1.617.2) was escalated to a variant of concern on 6 May 2021 (VOC21APR-02).
Surveillance through genomic data
Table 10. Number of confirmed and probable VOC-21APR-02 (B.1.617.2) cases, by region of residence as of 25 May 2021
| Region |
Case Number |
Case Proportion |
Cases that have travelled |
Proportion of travellers among cases |
| East Midlands |
535 |
9.6% |
56 |
10.5% |
| East of England |
713 |
12.7% |
83 |
11.6% |
| London |
991 |
17.7% |
204 |
20.6% |
| North East |
81 |
1.4% |
10 |
12.3% |
| North West |
2,486 |
44.4% |
39 |
1.6% |
| South East |
315 |
5.6% |
87 |
27.6% |
| South West |
98 |
1.8% |
44 |
44.9% |
| West Midlands |
258 |
4.6% |
51 |
19.8% |
| Yorkshire and Humber |
108 |
1.9% |
22 |
20.4% |
| Unknown region |
14 |
0.3% |
|
NA |
| England |
5,599 |
– |
596 |
10.6% |
*Denominator is all cases, including those with unknown or pending travel status
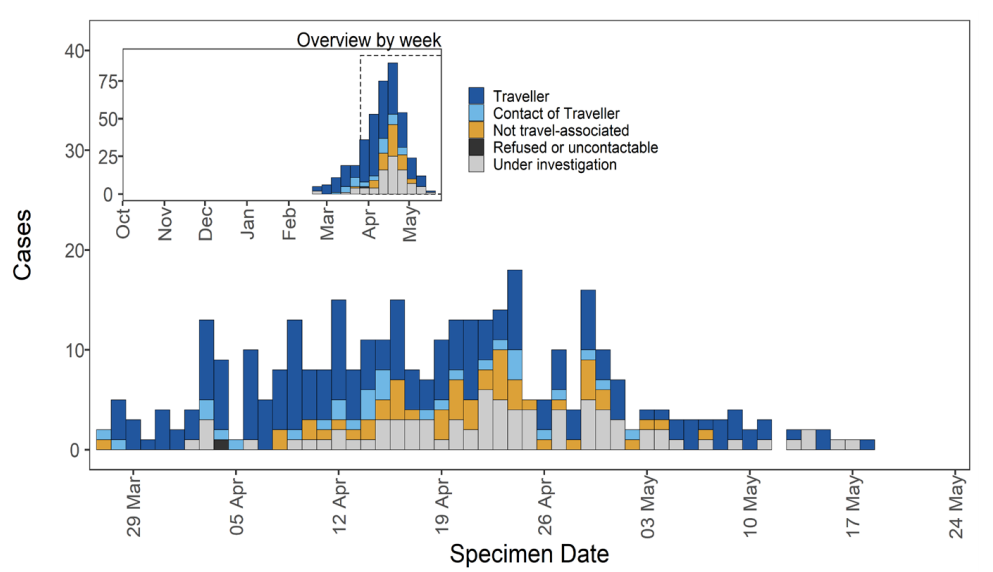
Figure 10. Confirmed and probable VOC-21APR-02 (B.1.617.2) cases by specimen date as of 25 May 2021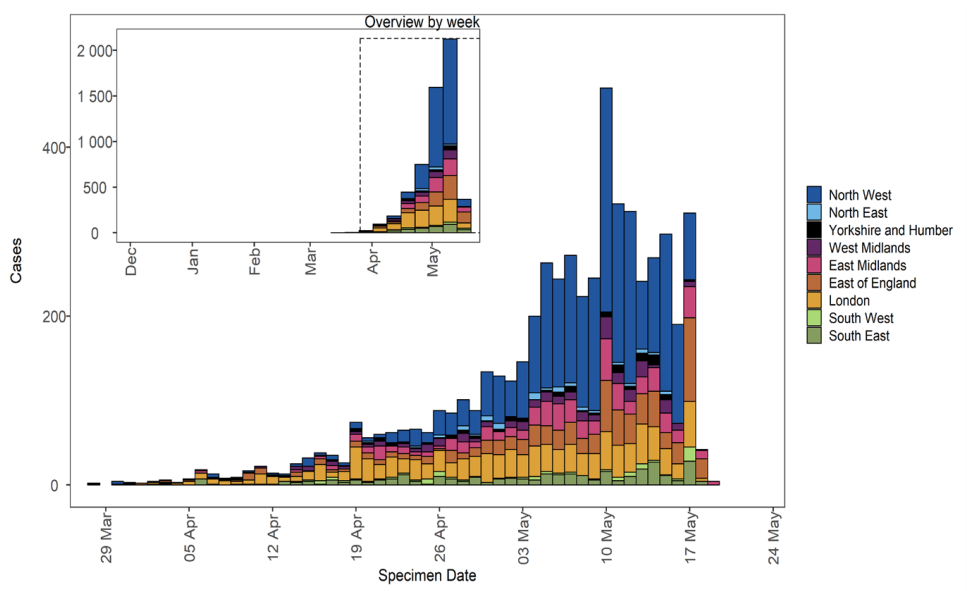
Larger plot includes last 60 days only. (Find accessible data used in this graph in underlying data)
Figure 11. Travel data for confirmed and probable VOC-21APR-02 (B.1.617.2) cases by specimen date as of 25 May 2021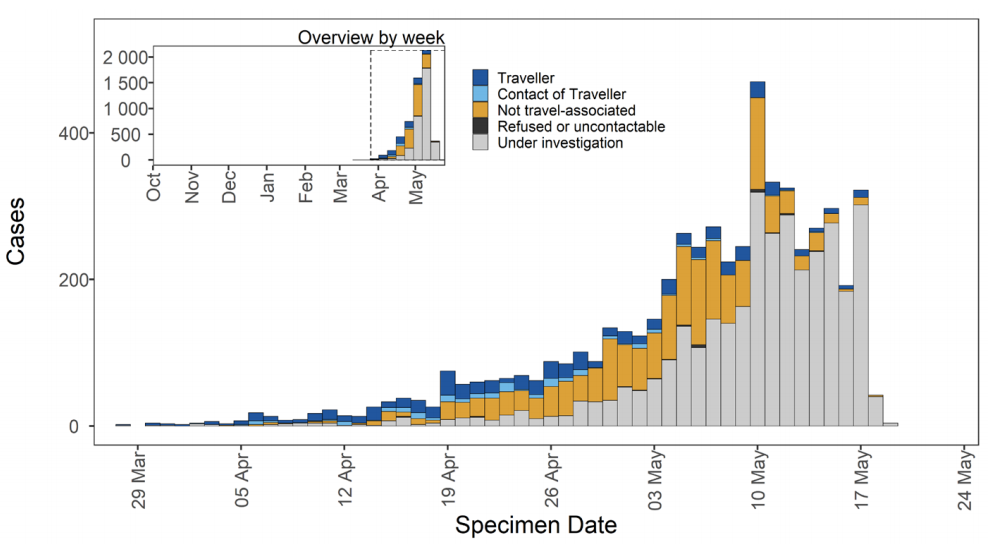
Larger plot includes last 60 days only. (Find accessible data used in this graph in underlying data)
Table 11 Additional spike mutations of interest detected in VOC-21APR-02 genomes in the UK
| Amino acid change |
Nucleotide change |
Total number of sequences (UK) |
Number of sequences 26 February to 25 March |
Number of sequences 26 March to 25 April |
Number of sequences 26 April to 25 May |
| Total |
7,388 |
4 |
813 |
6,570 |
| P681R |
23604G |
7,372 |
4 |
810 |
6,557 |
| L452R |
22917G |
7,262 |
4 |
809 |
6,448 |
| G142D |
21987A |
4,466 |
3 |
583 |
3,880 |
| K417N |
22813T |
29 |
0 |
1 |
28 |
| G446V |
22899T |
9 |
0 |
4 |
5 |
| Q677H |
23593T |
9 |
0 |
6 |
3 |
| S255F |
22326T |
6 |
0 |
2 |
4 |
| V503I |
23069A |
6 |
0 |
0 |
6 |
| L244S |
22293C |
5 |
0 |
0 |
5 |
| E484A |
23013C |
4 |
0 |
0 |
4 |
| S494L |
23043T |
3 |
0 |
0 |
3 |
| A701V |
23664T |
2 |
0 |
1 |
1 |
| D80A |
21801C |
1 |
0 |
0 |
1 |
| P251L |
22314T |
1 |
0 |
0 |
1 |
| D405Y |
22775T |
1 |
0 |
0 |
1 |
| L455F |
22927T |
1 |
0 |
1 |
0 |
| S477I |
22992T |
1 |
0 |
0 |
1 |
| P479S |
22997T |
1 |
0 |
0 |
1 |
| V483F |
23009T |
1 |
0 |
0 |
1 |
| E484Q |
23012C |
1 |
0 |
0 |
1 |
| R682W |
23606T |
1 |
0 |
0 |
1 |
| R683Q |
23610A |
1 |
0 |
0 |
1 |
| R683L |
23610T |
1 |
0 |
0 |
1 |
This data uses the numbers of genomes in the national genomic dataset rather than case numbers. Further investigations of K417N genomes are being undertaken.
Spatial variation in risk
The spatial risk surface is estimated by comparing the smoothed intensity of cases (variants of concern) and controls (PCR +ve, non-variants of concern) across a defined geographical area to produce an intensity (or risk) ratio. If the ratio is ~1, this suggests that the risk of infection is unrelated to spatial location. Evidence of spatial variation in risk occurs where the intensities differ. Ratio values >1 indicate an increased risk and values < 1 indicate lower risk. Figure 12 highlights areas of significantly increased risk identified for VOC-21APR-02 (B.1.617.2) and the differences between data presented in technical briefing 12 and 13. London is no longer demonstrating an increased intensity ratio.
Figure 12. Spatial variation in risk for VOC-21APR-02 (B.1.617.2) data from 1 October 2020, excluding cases that are known to have travelled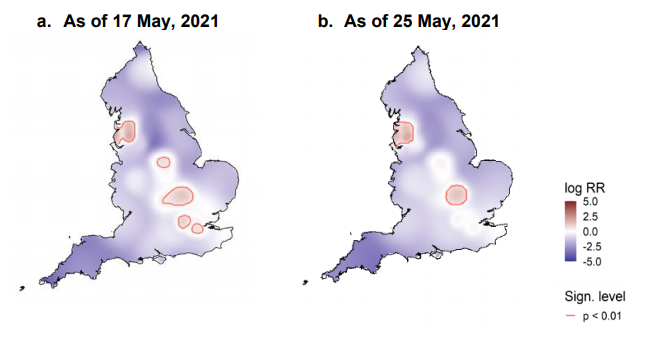
This figure excludes cases in managed quarantine facilities. Supplementary data is not available for this figure.
Cluster analysis
SARS-CoV-2 clusters initiated by cases linked to recent India travel tend to be larger if the traveller carries VOC-21APR-02 (B.1.617.2) in comparison to VOC-20DEC-01 (B.1.1.7) after adjusting for time of the first case in each cluster (Figure 13, negative binomial GLM p = 0.0498).
Clusters were derived by a maximum parsimony reconstruction of the geographic location in a maximum likelihood SARS-CoV-2 phylogeny provided by the UK COVID-19 Genomics Consortium. When comparing cluster sizes, only sequences sampled in England Pillar 2 and excluding travellers were included. Persons under the age of 20 were excluded. After identifying clusters linked to India travel, 104 VOC-21APR-02 (B.1.617.2) clusters were retained with a mean origin date of 26 April 2021 and a mean size of 20.3. A further 469 VOC-20DEC-01 (B.1.1.7) clusters were retained with a mean origin date of February 21, 2021 and a median size of 22.1.
Older clusters tend to be larger than recently introduced clusters, and VOC-21APR-02 (B.1.617.2) India-linked clusters were introduced later on average than VOC-20DEC-01 (B.1.1.7) India-linked clusters. The principal findings in this iteration of the analysis are that the regional composition (NHS region) of clusters was not a significant predictor of cluster size (p>0.13), a larger number of traveller cases detected at the origin of each cluster was associated with larger cluster sizes (p=0.0007), and after adjusting for the number of travellers at the origin of each cluster, VOC-21APR-02 clusters were not significantly larger than VOC-20DEC-01 clusters (p=0.19).
Figure 13. Clustering of VOC-20DEC-01 (B.1.1.7) and VOC-21APR-02 (B.1.617.2) by region as of 25 May 2021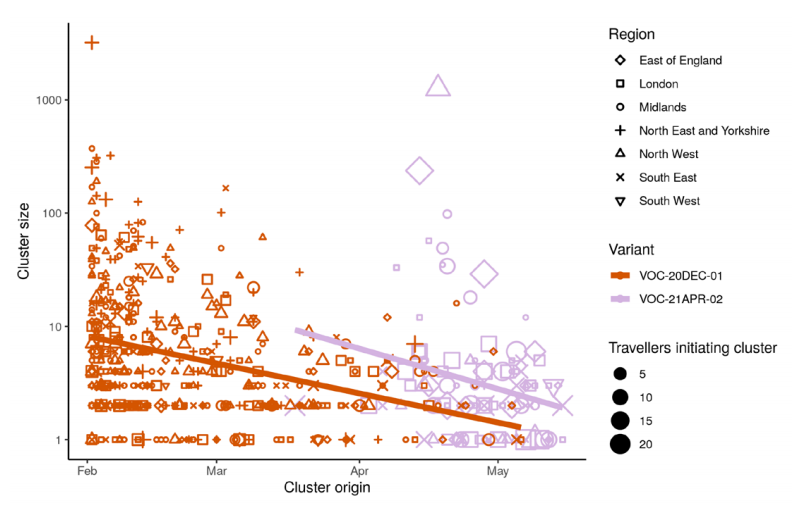
The size of phylogenetic clusters initiated by cases linked to travel from India is shown versus the time of origin of each cluster (time of first sample). Lines show a linear regression for lineages VOC-20DEC-01 (B.1.1.7) and VOC-21APR-02 (B.1.617.2). (Find accessible data used in this graph in underlying data)
Surveillance of cases in travellers from India
Figure 14. Lineages of cases with recent travel history from India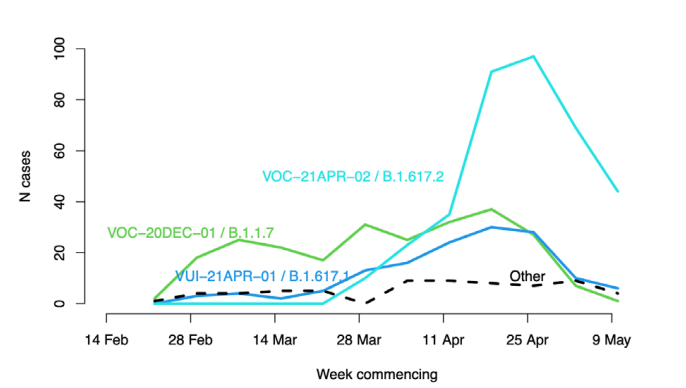
Each line shows the count of cases by test date of that lineage with known travel history from India within 14 days of testing positive: VOC-20DEC-01 (B.1.1.7) in green, VUI-21APR-01 (B.1.617.1) in blue, VOC-21-APR-02 (B.1.617.2) in cyan, other lineages as dashed line (22 February 2021 to 16 May 2021, final week incomplete). (Find accessible data used in this graph in underlying data).
Surveillance through S gene detection
The S gene target in a 3-target assay (S, N and ORF1ab) used in some Lighthouse Laboratories fails in VOC-20DEC-01 (B.1.1.7) the previously dominant variant. However, this S gene is detected in VUI-21APR-01 (B.1.617.1), VOC-21APR-02 (B.1.617.2) and VUI-21APR-03 (B.1.617.3) variants. It is also detected in VOC-20DEC02 (B.1.351) and other variants. Specimens with a detectable S gene (also referred to as S gene positive) are defined as those with cycle threshold (CT) values of ≤30 in all 3 gene targets: S, N, and ORF1ab.
Figure 15 shows the number of sequenced S gene positive isolates over time since January 2021 (data as of 25 May 2021), as well as the distribution of identified variants among these specimens. Unclassified variants refer to those not currently considered a VOC or VUI; these dominated the sequenced S gene positive specimens at the beginning of 2021 and have decreased to less than 1% in the most recent week of data (11 May to 17 May 2021, Figure 16). Comparatively, the proportion of confirmed VOC-21APR-02 specimens among S gene positives continues to increase, to 97.3% in the week starting 11 May 2021 (note incomplete week due to reporting delays). This is largely consistent across regions, however lower in Yorkshire and Humber where variant VUI-21MAY-01, which is also S gene positive, is present. Additionally, this proxy is limited by variable TaqPath laboratory coverage across England (Figure 17), and biases in sequencing, for instance targeting of contacts of variant cases in outbreak settings.
The number and proportion of S gene positive samples in England (Figure 18) has also steadily increased since mid-April, with more than 4,000 in the week starting 18 May; 73.5% of all cases tested on the TaqPath assay and reported to PHE that week. Almost all regions now have majority S gene positive cases in the most recent week (Figure 19), although with highest numbers concentrated in a small number of local authorities (Figures 17 and 20). Several of these areas, in particular Bolton, Blackburn with Darwen, and Bedford, also have high total case rates (Figure 20), although are also located in areas where a higher proportion of specimens are tested in laboratories which use the TaqPath PCR assay (Figure 17).
Figure 15. Weekly distribution of variants among sequenced S gene positive SARS-CoV-2 specimens Specimen dates between 1 January 2021 and 15 May 2021, data as of 25 May 2021. Gray shading applied to 14 most recent days of data as these are affected by reporting delay. (Find accessible data used in this graph in underlying data).
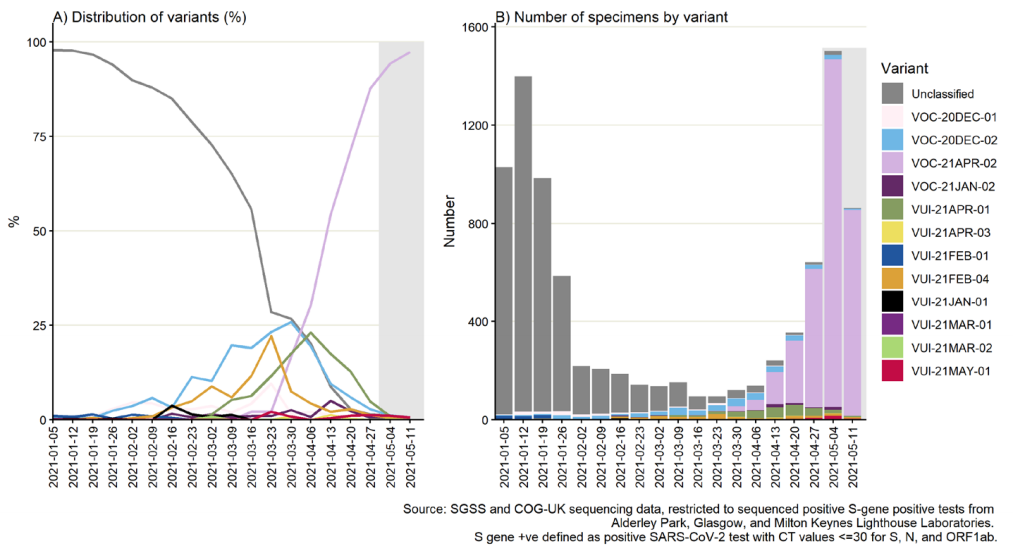 Figure 16. Weekly distribution of variants among sequenced S gene positive SARS-CoV-2 specimens, by region of residence
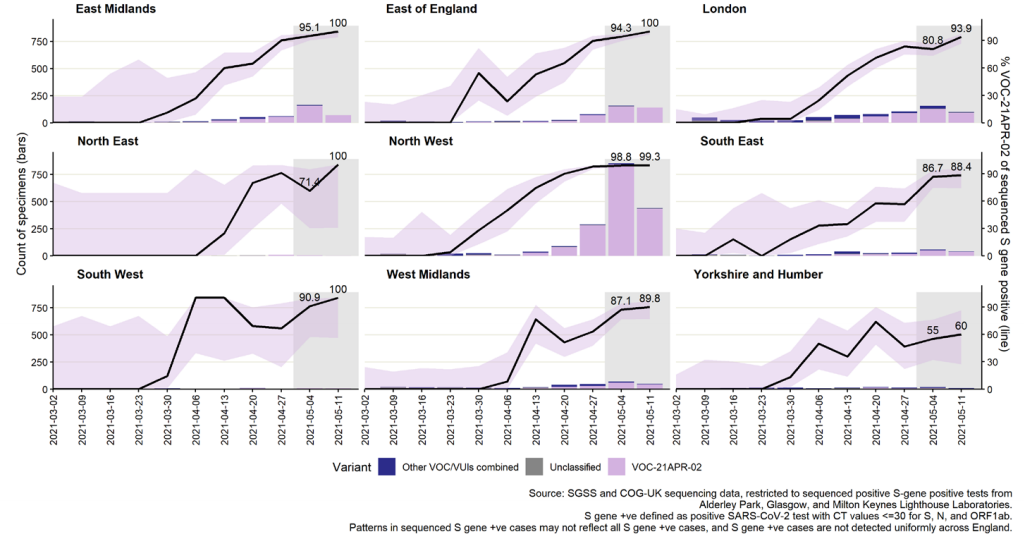
In figure 16 the black line represents weekly proportion of specimens that are VOC21APR-02 with most recent 2 weeks labelled and 95% confidence intervals in lilac. Proportions for other variants not shown but are grouped for counts (bars). Specimen dates between 1 January 2021 and 15 May 2021, data as of 25 May 2021. Gray shading applied to 14 most recent days of data as these are affected by reporting delay. (Find accessible data used in this graph in underlying data).
Figure 17. Number of cases with detectable S gene target and TaqPath lab test coverage by local authority of residenceSpecimen dates for figure 17; 15 May 2021 to 21 May 2021, data as of 25 May 2021; most recent 3 days excluded to reporting delay (Find accessible data used in this graph in underlying data).
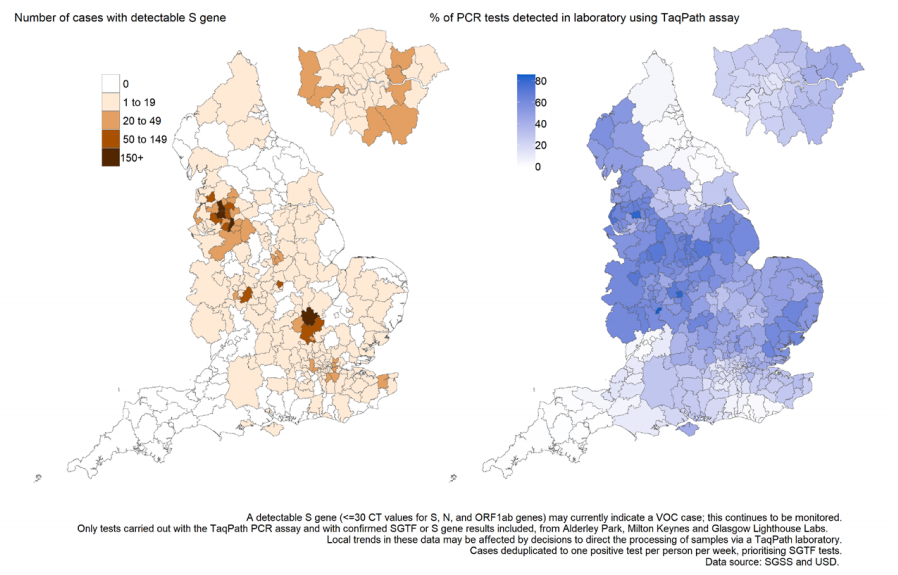 Figure 18. Weekly number and proportion of England Pillar 2 COVID-19 cases with SGTF and detectable S gene target among those tested with the TaqPath assay
 Specimen dates between 1 September 2020 to 24 May 2021, data as of 25 May 2021 (Find accessible data used in this graph in underlying data).
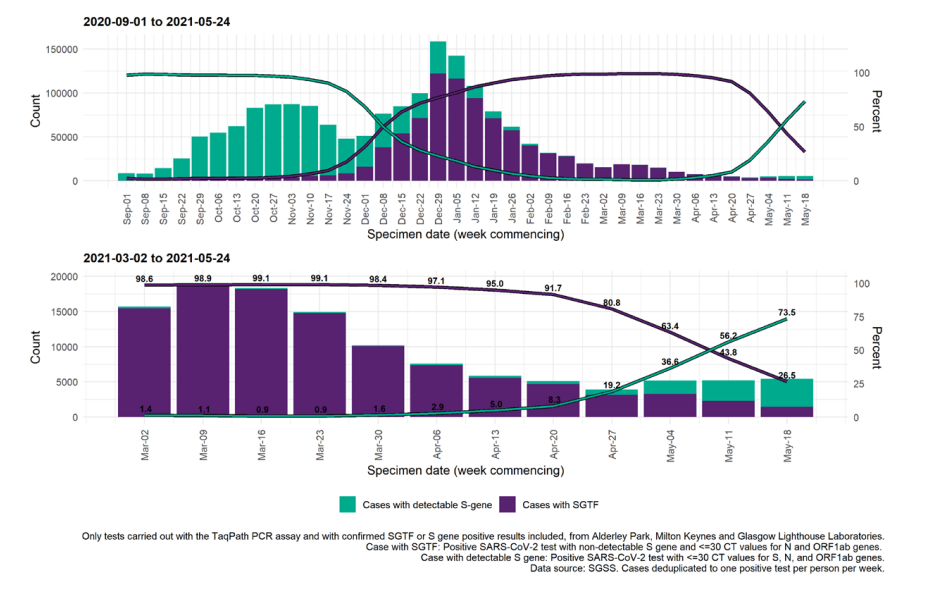 Figure 19. Weekly number and proportion of England Pillar 2 COVID-19 cases with detectable S gene target or SGTF among those tested with the TaqPath assay, by region of residence
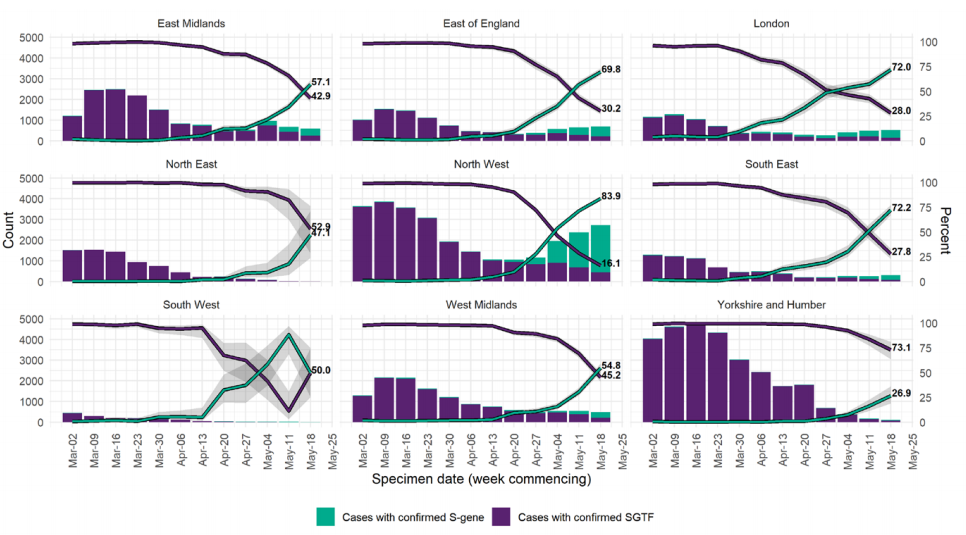
In figure 19; specimen dates between 2 March 2021 and 24 May 2021, data as of 25 May 2021; 95% confidence intervals indicated by grey shading and percentage for most recent week labelled (Find accessible data used in this graph in underlying data).
Figure 20. 7-day COVID-19 case rates per 100,000 population vs proportion S gene positive cases among those tested with TaqPath assay, by upper tier local authority (UTLA) of residence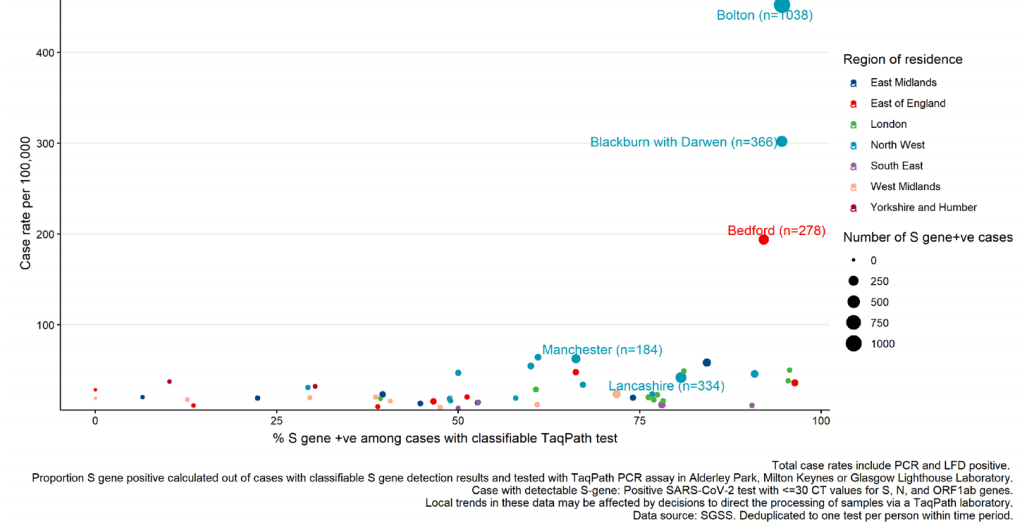
Specimen dates between 15 May 2021 and 21 May 2021, data as of 25 May 2021 (3 most recent days excluded due to reporting delay). Restricted to UTLAs with >20 cases tested on TaqPath assay. Five UTLAs with highest number of S gene positive cases labelled. (Find accessible data used in this graph in underlying data).
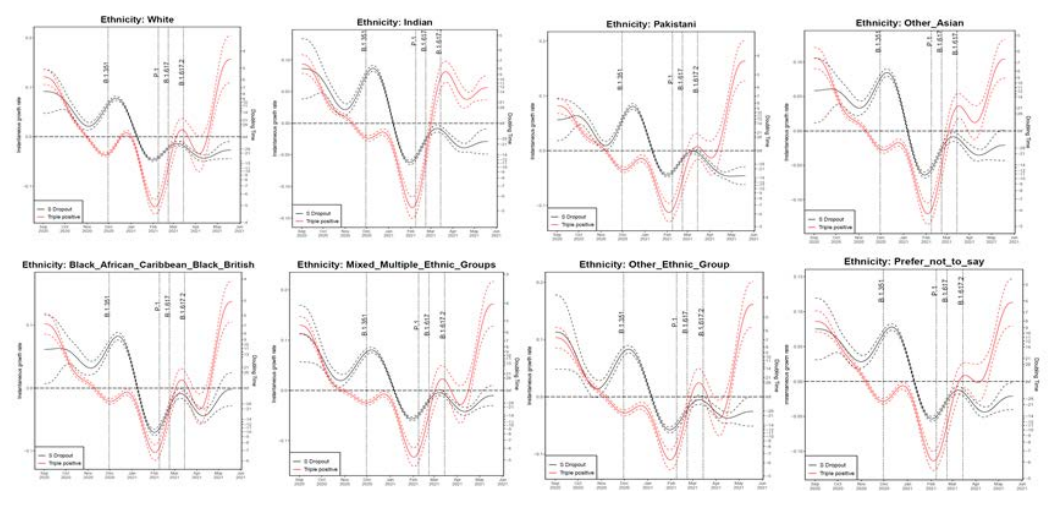
Growth rate of S gene positive and negative cases
Figures 21 and 22 show growth rate and doubling time of S gene positive and negative (S gene target failure), for region and ethnicity, produced by fitting a generalized additive model with a quasi-Poisson.
The left vertical axis in both figures describe the daily rates of exponential growth; and the right vertical axis the corresponding daily doubling times, that is number of days required for cases to double at that particular growth rate. The dashed lines represent uncertainty (95% CI), which grows approaching the plot edges because the number of data points used for the estimation becomes smaller. Note that, if an epidemic trend changes from growth to decline, the growth rates change from positive to negative, while the doubling times become longer and longer, cross infinity when the trend is temporarily flat, and turn into halving times (that is number of days it takes for cases to halve), represented as negative doubling times
Figure 21. Growth rate and doubling time of S gene positive and negative cases by region as of 20 May 2021 The growth rate for cases with all 3 PCR targets positive has been increasing over the course of April and May in all regions. The East Midlands and the East of England are the only regions seeing growth in cases with the S-dropout. Confidence intervals are wide for most regions, and data on PCR targets is low in some regions (East of England, South West, North East, Yorkshire and Humber). (Find accessible data used in this graph in underlying data).
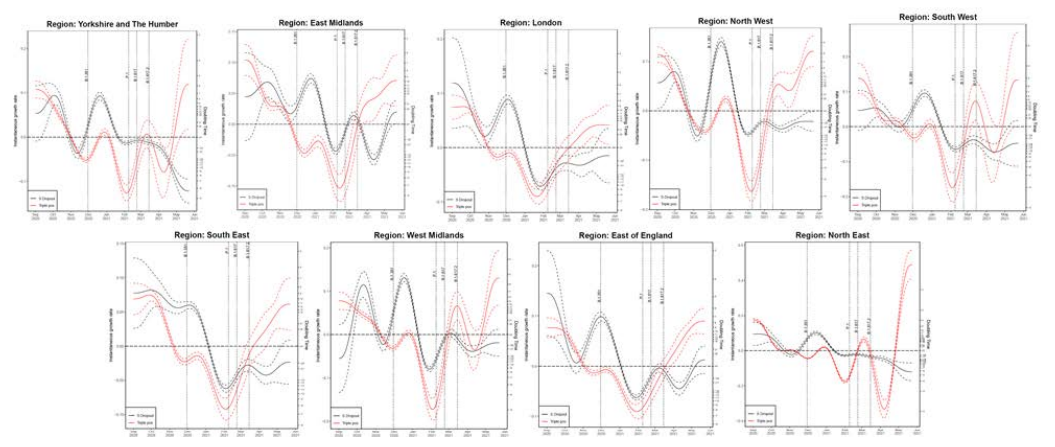 Figure 22. Growth rate and doubling time of S gene positive and negative cases by ethnicity as of 20 May 2021
The growth rate for cases with all 3 PCR targets positive has been increasing over the course of April and May in all ethnicities. The growth rates for the Indian ethnicity appear to have levelled, whilst growth rate in other ethnicities continues to rise. (Find accessible data used in this graph in underlying data). Confidence intervals are wide, and data on PCR targets is low in some regions.
Live virus and pseudovirus neutralization
Neutralisation studies of VOC-21APR-02 (B.1.617.2) have been conducted by the Genotype to Phenotype Consortium laboratories (Imperial College London, Centre for Virus Research Glasgow, Pirbright Virology Institute, the Francis Crick Institute), PHE Colindale and Oxford University. There are reductions in neutralising activity seen across multiple sera and laboratories including:
• first wave convalescent sera tested against live virus
• vaccinee sera tested against pseudovirus with B.1.617.2. spike
• a panel of 220 vaccinee sera from the Legacy study (University College London
Hospitals/Francis Crick Institute) tested against live virus
These changes are greater than the reduction seen for VOC-20DEC-01 (B.1.1.7). Whilst outputs from individual assays vary, the consensus view is that the magnitude of the change is likely to lie between that seen for B.1.1.7 and B.1.351. Further assessment is in process.
Monitoring of vaccine effectiveness
The vaccine effectiveness analyses undertaken previously were iterated including data up to the end of week 21. This provides estimates of vaccine effectiveness against symptomatic disease, methods are described in Effectiveness of COVID-19 vaccines against the B.1.617.2 variant. The analysis now includes 7673 symptomatic cases identified as B.1.1.7 and 2934 cases identified as B.1.617.2. Results remain similar to those seen last week, though with increased precision. After a single dose there was a 17% absolute reduction in vaccine effectiveness against symptomatic disease with B.1.617.2 compared to B.1.1.7, but only a modest reduction in vaccine effectiveness after 2 doses (Table 12).
Table 12.
| Vaccination status |
Vaccine Effectiveness |
|
VOC-20DEC-01 (B.1.1.7) |
VOC21-APR-02 (B.1.617.2) |
| Dose 1 |
50.2 (46.7 to 53.5) |
33.2 (25.8 to 39.9) |
| Dose 2 |
88.4 (85.7 to 90.7) |
80.8 (76.3 to 84.4) |
Serial interval and viral load dynamics
The Assessment of Transmission and Contagiousness of COVID-19 in Contacts (ATACCC) study (NIHR Health Protection Research Unit in Respiratory Infections, PHE and Imperial College London) has been reopened to recruitment as of 24 May 2021 to assist with characterisation of B.1.617.2.
The study analyses secondary attack rates, serial intervals and viral load dynamics, by performing intensive, longitudinal PCR sampling of contacts of newly diagnosed COVID19 cases in the community, accompanied by collection of symptom diaries and demographic data.
VUI-21APR-01 (B.1.617.1)
Table 13. Number of confirmed and probable VUI-21APR-01 (B.1.617.1) cases, by region of residence as of 25 May 2021
| Region |
Case Number |
Case Proportion |
Cases that have travelled |
Proportion of travellers among cases |
| East Midlands |
49 |
12.1% |
25 |
51.0% |
| East of England |
34 |
8.4% |
20 |
58.8% |
| London |
170 |
41.9% |
96 |
56.5% |
| North East |
4 |
1.0% |
2 |
50.0% |
| North West |
32 |
7.9% |
21 |
65.6% |
| South East |
42 |
10.3% |
25 |
59.5% |
| South West |
11 |
2.7% |
8 |
72.7% |
| West Midlands |
48 |
11.8% |
19 |
39.6% |
| Yorkshire and Humber |
16 |
3.9% |
12 |
75.0% |
| England |
406 |
– |
228 |
56.2% |
*Denominator is all cases, including those with unknown or pending travel status. Travel status in this table and all subsequent travel data in this document is based on information provided through the Contact Tracing Advisory Service (CTAS) and passenger locator forms where available. Travel status for cases under investigation is confirmed after follow up and is updated regularly.
Figure 23. Spatial variation in risk for VUI-21APR-01 (B.1.617.1) data from 1 October 2020, as of 25 May 2021, excluding cases that are known to have travelledSupplementary data is not available for this figure. This figure excludes cases in managed quarantine facilities
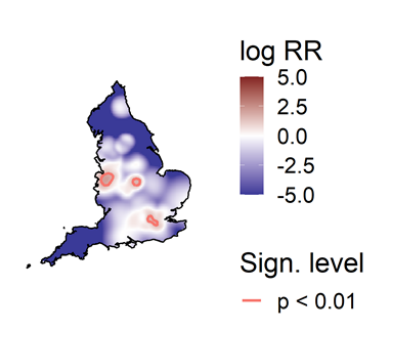 Figure 24. Confirmed and probable VUI-21APR-01 (B.1.617.1) cases by specimen date as of 25 May 2021
Larger plot includes last 60 days only. (Find accessible data used in this graph in underlying data).
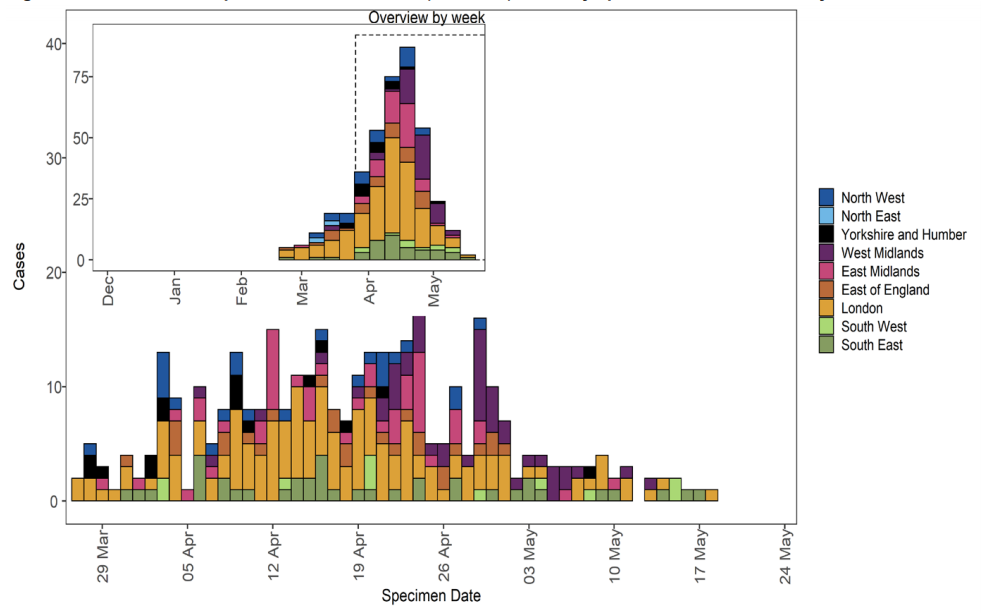 Figure 25. Travel data for confirmed and probable VUI-21APR-01 (B.1.617.1) cases by specimen date as of 25 May 2021
Larger plot includes last 60 days only. (Find accessible data used in this graph in underlying data). N/A indicates information is pending or not available.
VUI-21APR-03 (B.1.617.3)
Table 14. Number of confirmed and probable VUI-21APR-03 (B.1.617.3) cases, by region of residence as of 25 May 2021
| Region |
Case Number |
Case Proportion |
Cases that have travelled |
Proportion of travellers among cases |
| East Midlands |
0 |
0.0% |
0 |
NA |
| East of England |
0 |
0.0% |
0 |
NA |
| London |
5 |
35.7% |
3 |
60.0% |
| North East |
0 |
0.0% |
0 |
NA |
| North West |
7 |
50.0% |
3 |
42.9% |
| South East |
2 |
14.3% |
1 |
50.0% |
| South West |
0 |
0.0% |
0 |
NA |
| West Midlands |
0 |
0.0% |
0 |
NA |
| Yorkshire and Humber |
0 |
0.0% |
0 |
NA |
| England |
14 |
– |
7 |
50.0% |
*Denominator is all cases, including those with unknown or pending travel status
Figure 26. Spatial variation in risk for VUI-21APR-03 (B.1.617.3) data from 1 October 2020, as of 25 May 2021, excluding cases that are known to have travelledSupplementary data is not available for this figure. This figure excludes cases in managed quarantine facilities.
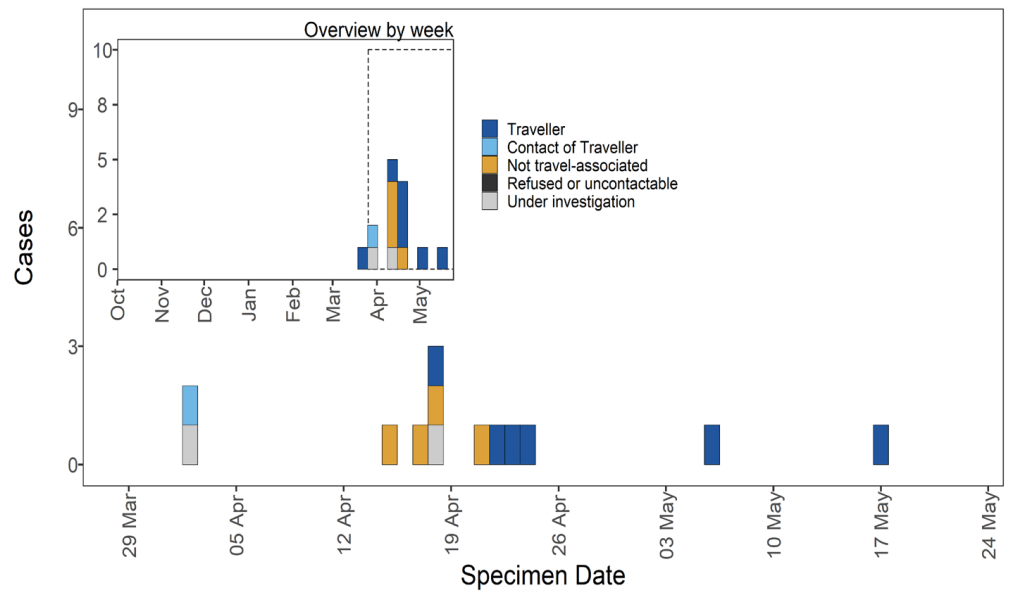
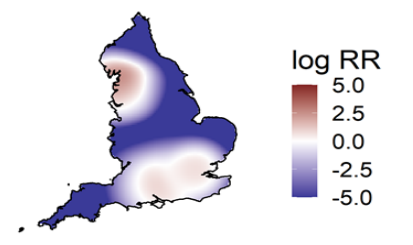 Figure 27. Confirmed and probable VUI-21APR-03 (B.1.617.3) cases by specimen date as of 25 May 2021
 Larger plot includes last 60 days only. (Find accessible data used in this graph in underlying data).
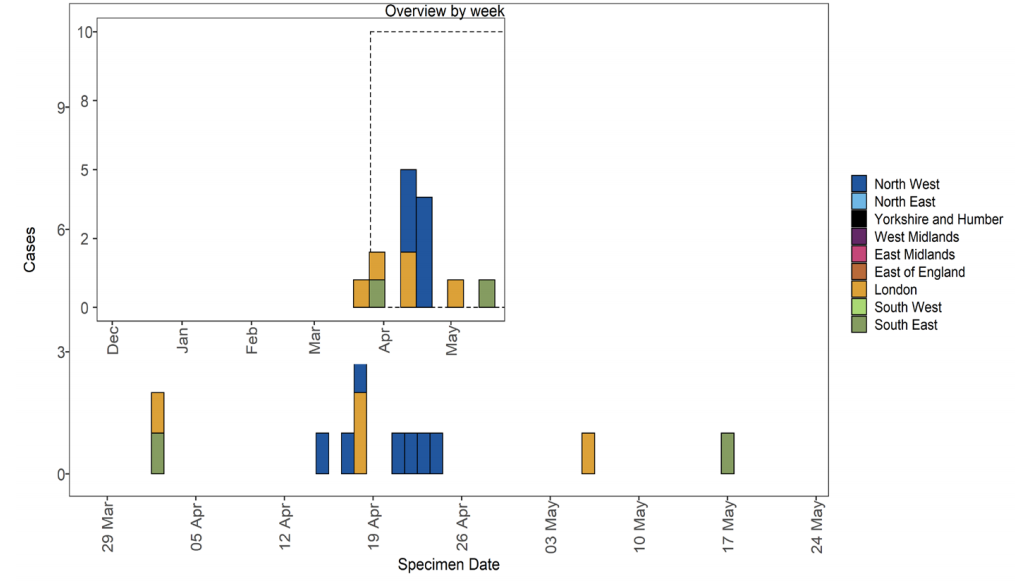 Figure 28. Travel data for confirmed and probable VUI-21APR-03 (B.1.617.3) cases by specimen date as of 25 May 2021
 Larger plot includes last 60 days only (Find accessible data used in this graph in underlying data). N/A indicates information is pending or not available.
International surveillance
GISAID includes data on sequences available internationally. As of 26 May 2021, sequences from the following countries (excluding UK) have been identified in GISAID:
VUI-21APR-01 (B.1.617.1) In total 2,099 sequences from: Australia, 29, Austria, 1, Bahrain, 8, Belgium, 8, Canada, 38, Curacao, 1, Czech Republic, 3, Denmark, 27, Finland, 1, France, 7, Germany, 84, Greece, 1, Guadeloupe, 2, Hong Kong, 9, India, 1472, Ireland, 39, Italy, 5, Japan, 19, Jordan, 4, Luxembourg, 5, Malaysia, 1, Mexico, 3, Nepal, 2, Netherlands, 9, New Zealand, 4, Portugal, 9, Saint Martin, 2, Singapore, 58, South Korea, 5, Spain, 4, Sweden, 5, Switzerland, 9, Thailand, 1, USA, 223, Uganda, 1
VOC-21APR-02 (B.1.617.2) In total 3,744 sequences from: Argentina, 1, Aruba, 3, Australia, 106, Austria, 3, Bahrain, 14, Bangladesh, 11, Belgium, 79, Canada, 125, China, 2, Democratic Republic of the Congo, 6, Denmark, 62, France, 50, Germany, 264, Greece, 1, Hong Kong, 3, India, 1309, Indonesia, 27, Iran, 4, Ireland, 89, Israel, 37, Italy, 51, Japan, 138, Jordan, 1, Luxembourg, 2, Malaysia, 4, Mexico, 20, Morocco, 1, Nepal, 12, Netherlands, 31, New Zealand, 11, Norway, 5, Poland, 24, Portugal, 29, Reunion, 1, Romania, 4, Russia, 1, Singapore, 100, Slovenia, 1, South Africa, 16, South Korea, 1, Spain, 43, Sweden, 11, Switzerland, 33, Thailand, 1, Turkey, 1, USA, 1003, Uganda, 3
VUI-21APR-03 (B.1.617.3) In total 64 sequences from: India, 61, Russia, 2, USA, 1
Part 3: New variant under investigation
VUI-21MAY-02 (C.36.3)
C.36.3 was designated a Variant Under Investigation on 24 May 2021 (VUI-21MAY-02) on the basis of the mutation profile and increased importation from a widening international area.
Genomic profile
The complete mutation profile of VUI-21MAY-02 (C.36.3) is shown in Table 15.
Table 15. C.36.3 Mutation profile
| Gene |
Mutations |
| orf1ab |
E102K, A859V, T1246I, D1639N, P2287S, D2980N, D3222N, G3278S, S3687L, L3691S, T4090I, P4715L, D5429Y |
| S |
S12F, del69-70, W152R, R346S, L452R, D614G, Q677H, A899S |
| M |
I82T |
| N |
R203K, G204R, G212V |
Genomic profile
VUI-21MAY-02 (C.36.3) contains several spike receptor binding domain (RBD) mutations linked to antigenic change including both L452R and R346S. Furthermore, it contains Nterminal domain (NTD) mutations potentially associated with antigenic change such as S12F and W152R. VUI-21MAY-02 also contains deletion 69-70 and Q677H, mutations also observed in other VOC/VUIs. Deletion 69-70 is associated with S gene target failure in the Taqpath assay which is used in surveillance analyses.
Surveillance in England
As of 25 May 2021, 109 genomically confirmed cases of VUI-21MAY-02 (C.36.3) have been identified in England. The regional distribution is shown in table 16.
Table 16: Cases of VUI-21MAY-02 (C.36.3) by region
| Region |
Number of cases of C.36.3 |
| East Midlands |
6 |
| East of England |
18 |
| London |
33 |
| North East |
1 |
| North West |
11 |
| South East |
8 |
| South West |
3 |
| West Midlands |
9 |
| Yorkshire and Humber |
20 |
International surveillance
GISAID includes data on sequences available internationally. As of 26 May 2021, sequences of VUI-21MAY-02 (C.36.3) from 34 countries has been identified on GISAID (Table 17)
Table 17. Country and number of sequences uploaded to GISAID as of 26th May 2021 for VUI-21MAY-02 (C.36.3)
| Germany |
148 |
| USA |
144 |
| Switzerland |
62 |
| Egypt |
33 |
| Belgium |
26 |
| France |
18 |
| Denmark |
16 |
| Italy |
14 |
| Sweden |
11 |
| Ireland |
10 |
| Norway |
6 |
| Austria |
6 |
| Canada |
4 |
| Indonesia |
4 |
| Spain |
4 |
| Israel |
4 |
| New Zealand |
3 |
| Latvia |
2 |
| Turkey |
2 |
| Lithuania |
2 |
| Slovenia |
2 |
| Belarus |
1 |
| Colombia |
1 |
| Greece |
1 |
| Poland |
1 |
| Lebanon |
1 |
| Singapore |
1 |
| India |
1 |
| Portugal |
1 |
| Philippines |
1 |
| Thailand |
1 |
| Chile |
1 |
| Australia |
1 |
| Netherlands |
1 |
Sources and acknowledgments
Data sources
Data used in this investigation is derived from the COG-UK dataset, the PHE Second Generation Surveillance System (SGSS), NHS Test and Trace, the Secondary Uses Service (SUS) dataset and Emergency Care Data Set (ECDS).
Variant Technical Group
Authors of this report
PHE Genomics Cell
PHE Outbreak Surveillance Team
PHE Epidemiology Cell
PHE Contact Tracing Data Cell
Variant Technical Group Membership
The PHE Variant Technical Group includes representation from the following organisations: PHE, DHSC, BEIS, Public Health Wales , Public Health Scotland, Public Health Agency Northern Ireland, Imperial College London, London School of Hygiene and Tropical Medicine, University of Birmingham, University of Cambridge, University of Edinburgh, University of Liverpool, the Wellcome Sanger Institute.
Acknowledgements
The authors are grateful to those teams and groups providing data for this analysis including: the Lighthouse Laboratories, COG-UK, the Wellcome Sanger Institute, tthe PHE Epidemiology Cell, Contact Tracing, Genomics and Outbreak Surveillance Teams.
Published: May 2021
PHE gateway number: GW-8226